Choosing a visualization
The selection of an appropriate visualization technique depends on the specific research objective and the characteristics of the features studied. Mapping ‘what is out there’ is often merely the first step towards a deeper understanding of landscape function and the social organization of ancient societies. For feature detection purposes, it is paramount to ensure a high level of contrast despite the potential introduction of local errors and locally indistinguishable data due to saturation. The objective is to ensure that a feature is sufficiently prominent to be recorded, without necessarily requiring an exact identification or understanding of its relationship to other features.
However, a more comprehensive understanding of the attributes of anthropogenic and natural structures can be achieved by using visualizations that are comparable across regions, free of artefacts, and that display most features equally well. This is especially important, if the goal to interpret or analyse specific features or landscapes or to discuss feature details. Visualizations used for these purposes must balance the need for contrast with the requirement of readability on diverse terrain. Our preferred choice is the combined Visualisation for Archaeological Topography (VAT) (combined VAT). We recommend replacing hillshading and many other techniques in scientific and technical literature with it because it offers all the benefits—it is easy to understand and works well as a background—but provides much more detail. When less contrast is desired, for example, when combined with very detailed vector layers showing a high density of features, VAT computed with a setting for general terrain is a good choice for a base map (Kokalj 2025).
See also
Find out more about the visualizations that RVT can produce in List of visualizations.
Characteristics of visualisations
Table 1: Assessment of visualization techniques regarding their characteristics.
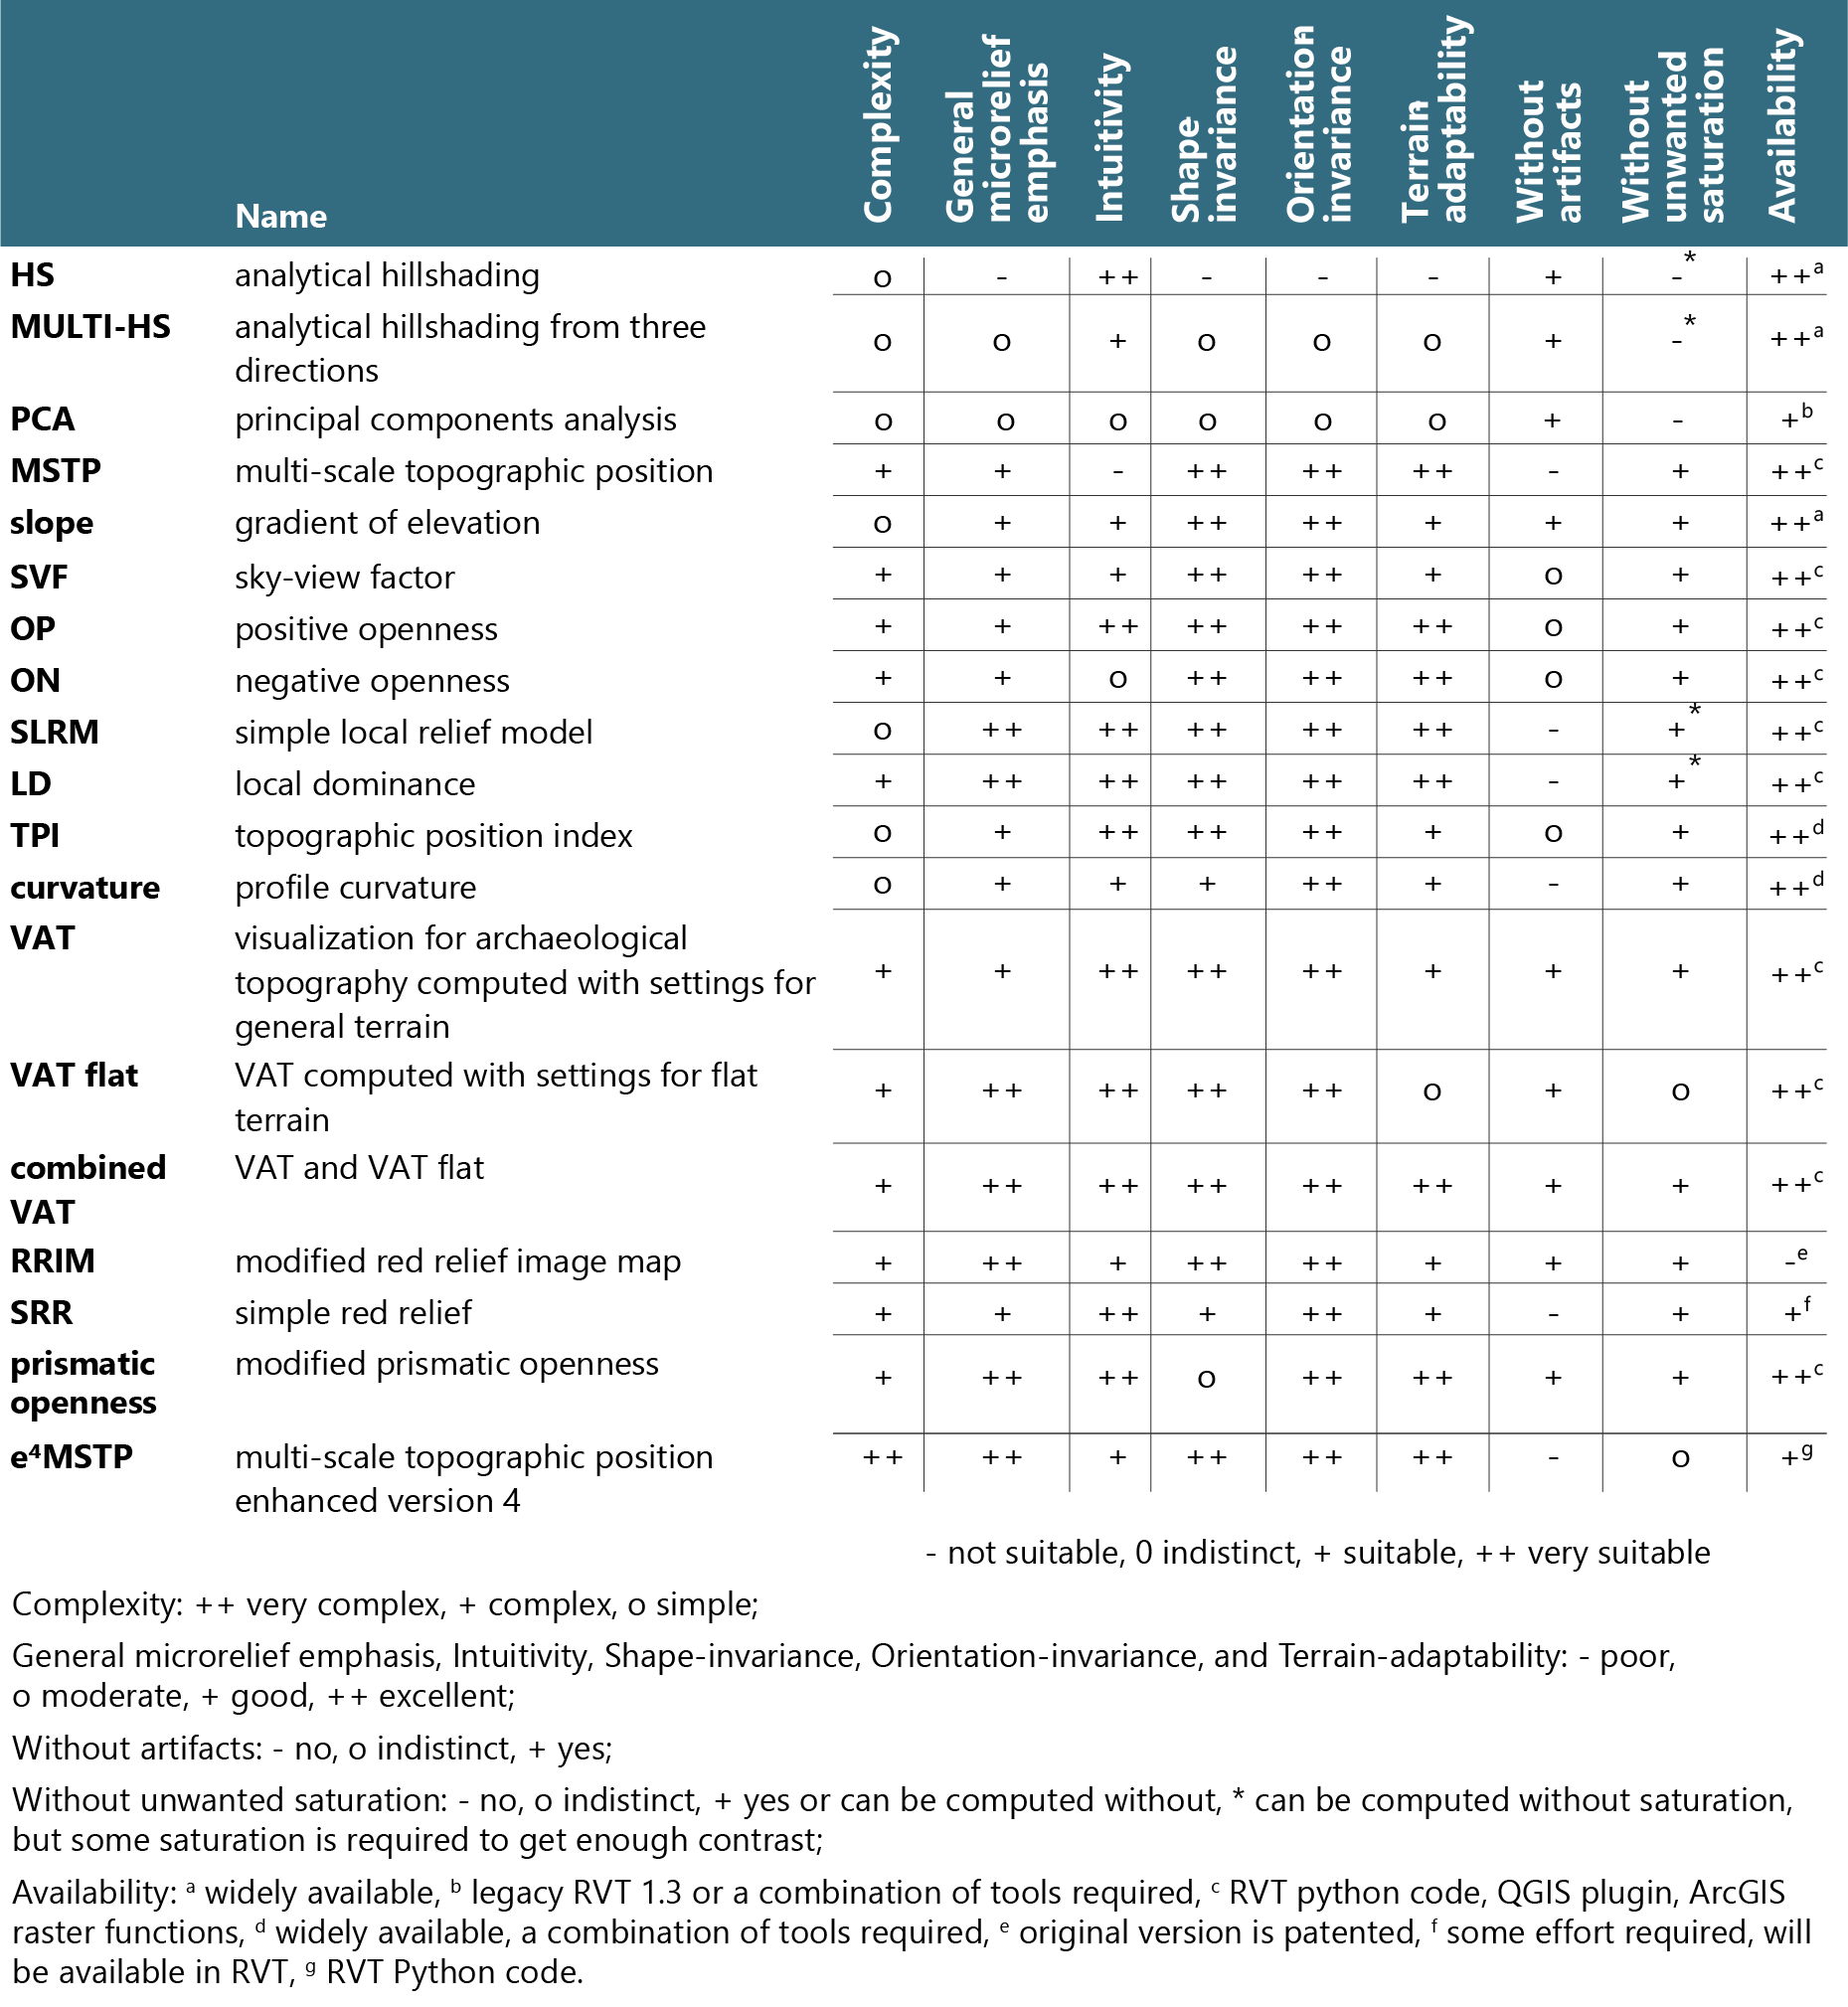
Source: Kokalj 2025.
By feature type
If you need some help to get started after trying combined VAT, consider the type of feature you’re working with.
Table 2: Assessment of visualization techniques for representing selected morphological feature types.
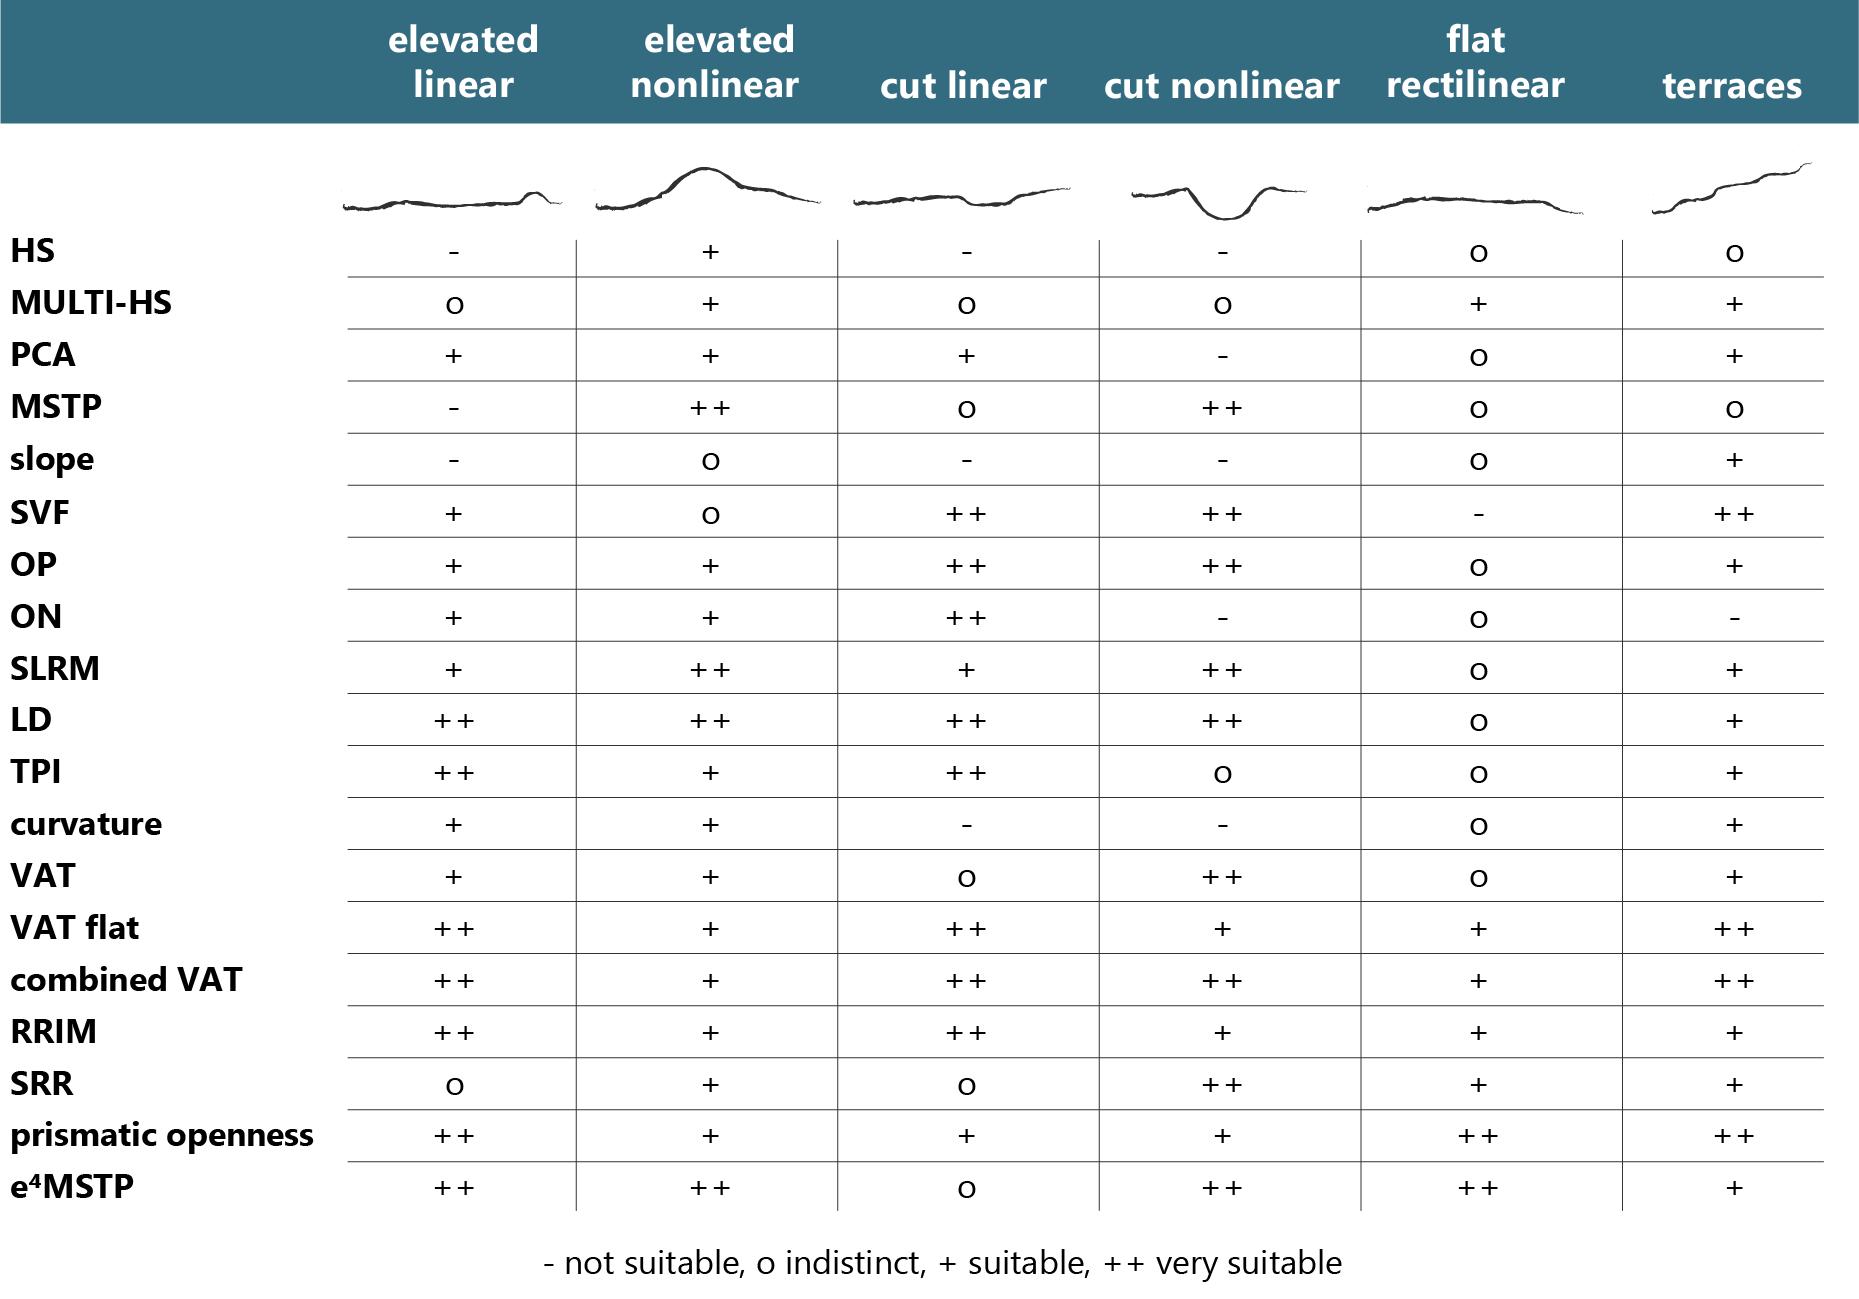
Source: Kokalj 2025.
Find out more about choosing visualisations in:
Kokalj, Žiga, Ralf Hesse. 2017. Airborne laser scanning raster data visualization: A Guide to Good Practice. Ljubljana: Založba ZRC.
Kokalj, Ž. 2025. Standardizing visualization in ancient Maya lidar research: Techniques, challenges and recommendations. Archaeological Prospection 32(4): 967-988.
Kokalj, Ž. Bennett, R. 2025. Visualising ALS Data. In: Bennett, R., Cowley, D. C. (eds). Guidelines for the use of Airborne Laser Scanning (Lidar) in Archaeology (EAC Guidelines 10).. European Archaeological Council, pp. 47-51.