RVT for QGIS
The RVT QGIS plugin uses the core RVT Python package. The plugin interface offers a user-friendly way to access all the functionality of the Python package.
See also
Find out how to install RVT for QGIS in QGIS installation.
Setting up
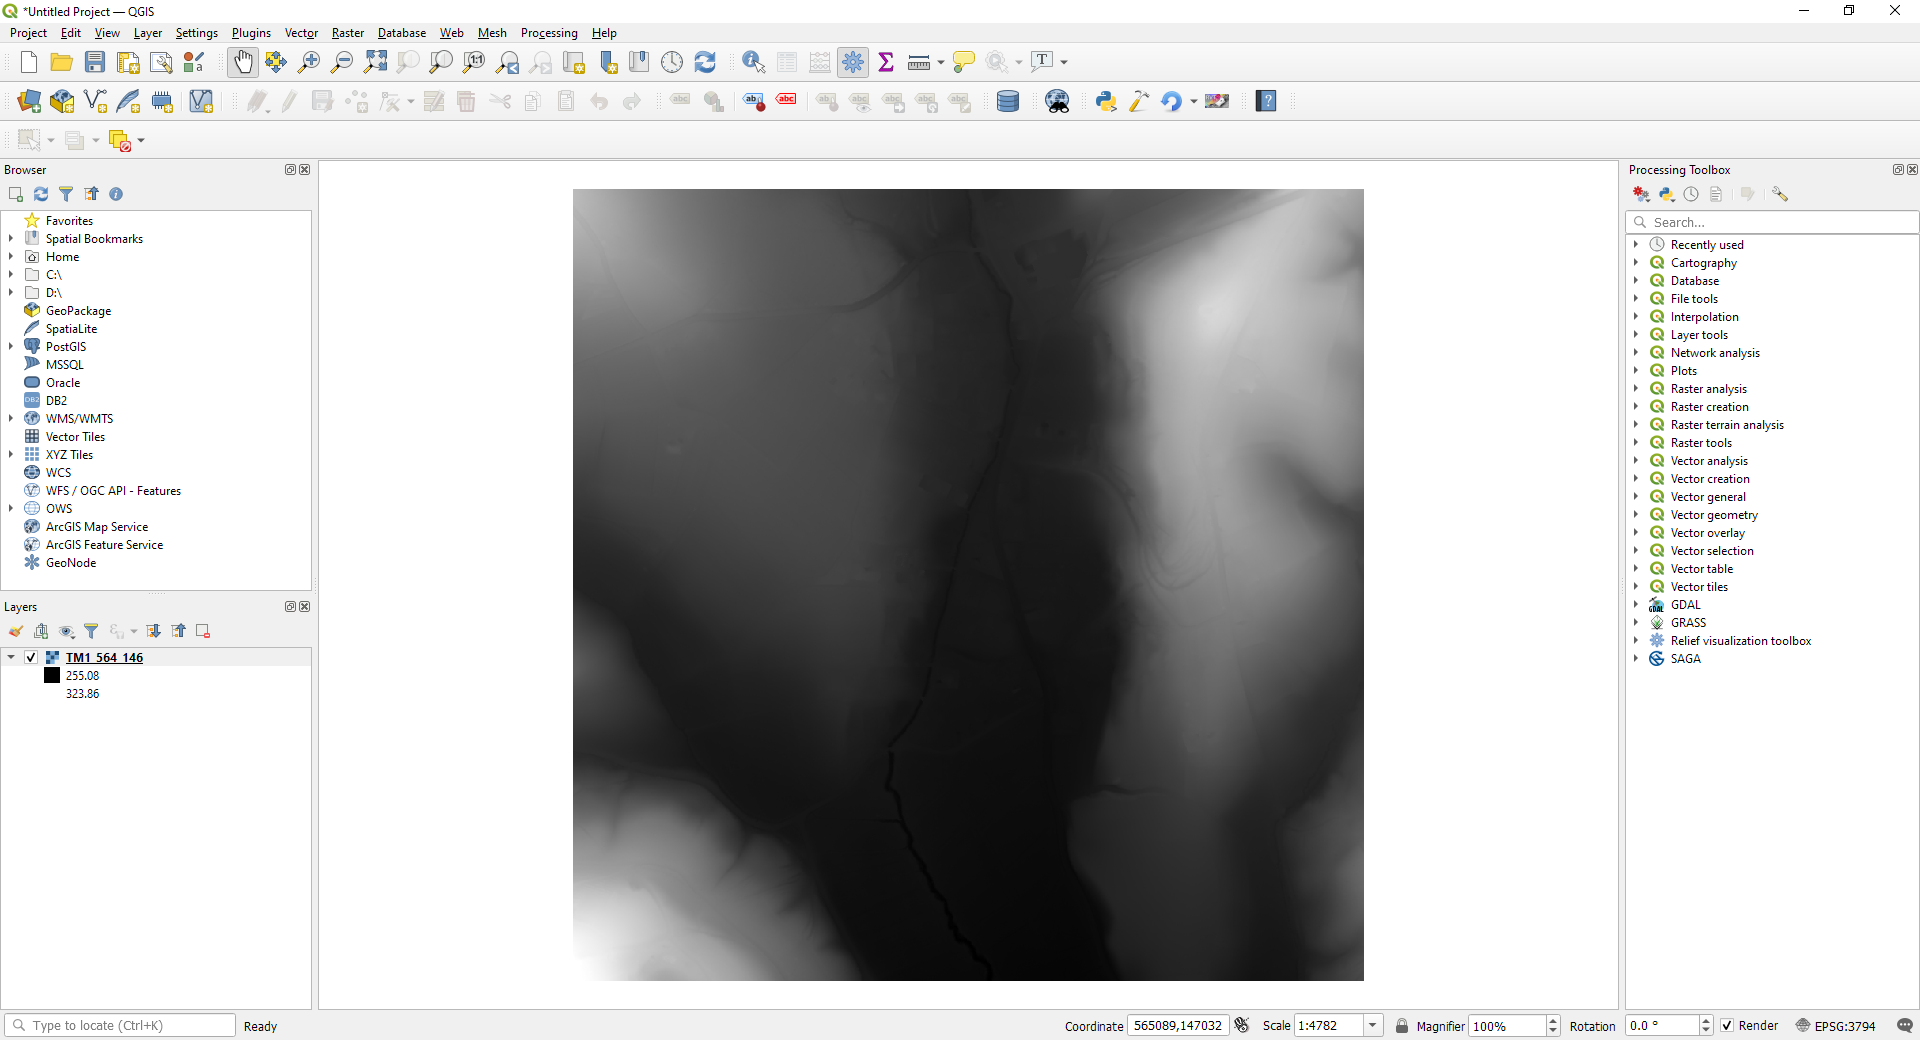
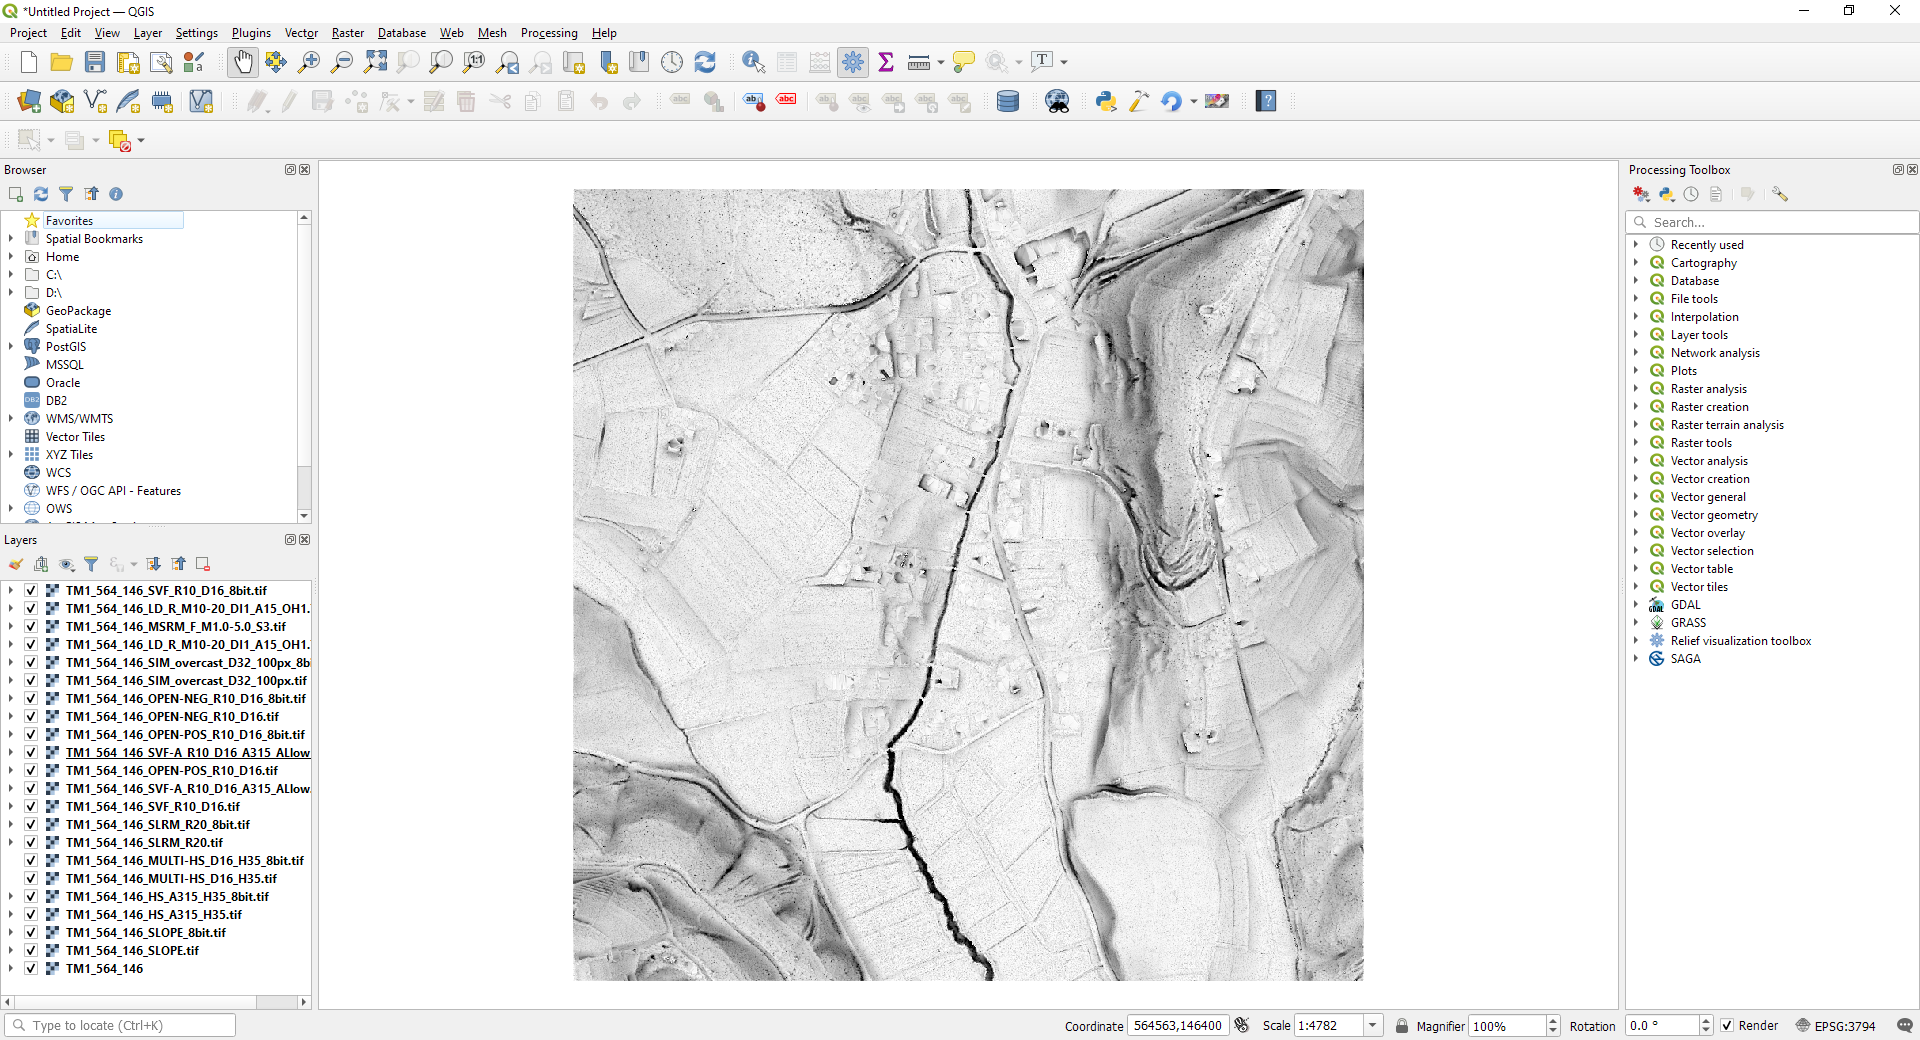
Open a DEM file to be visualized.
Select
Raster → Relief Visualization Toolboxor the RVT icon in the toolbar.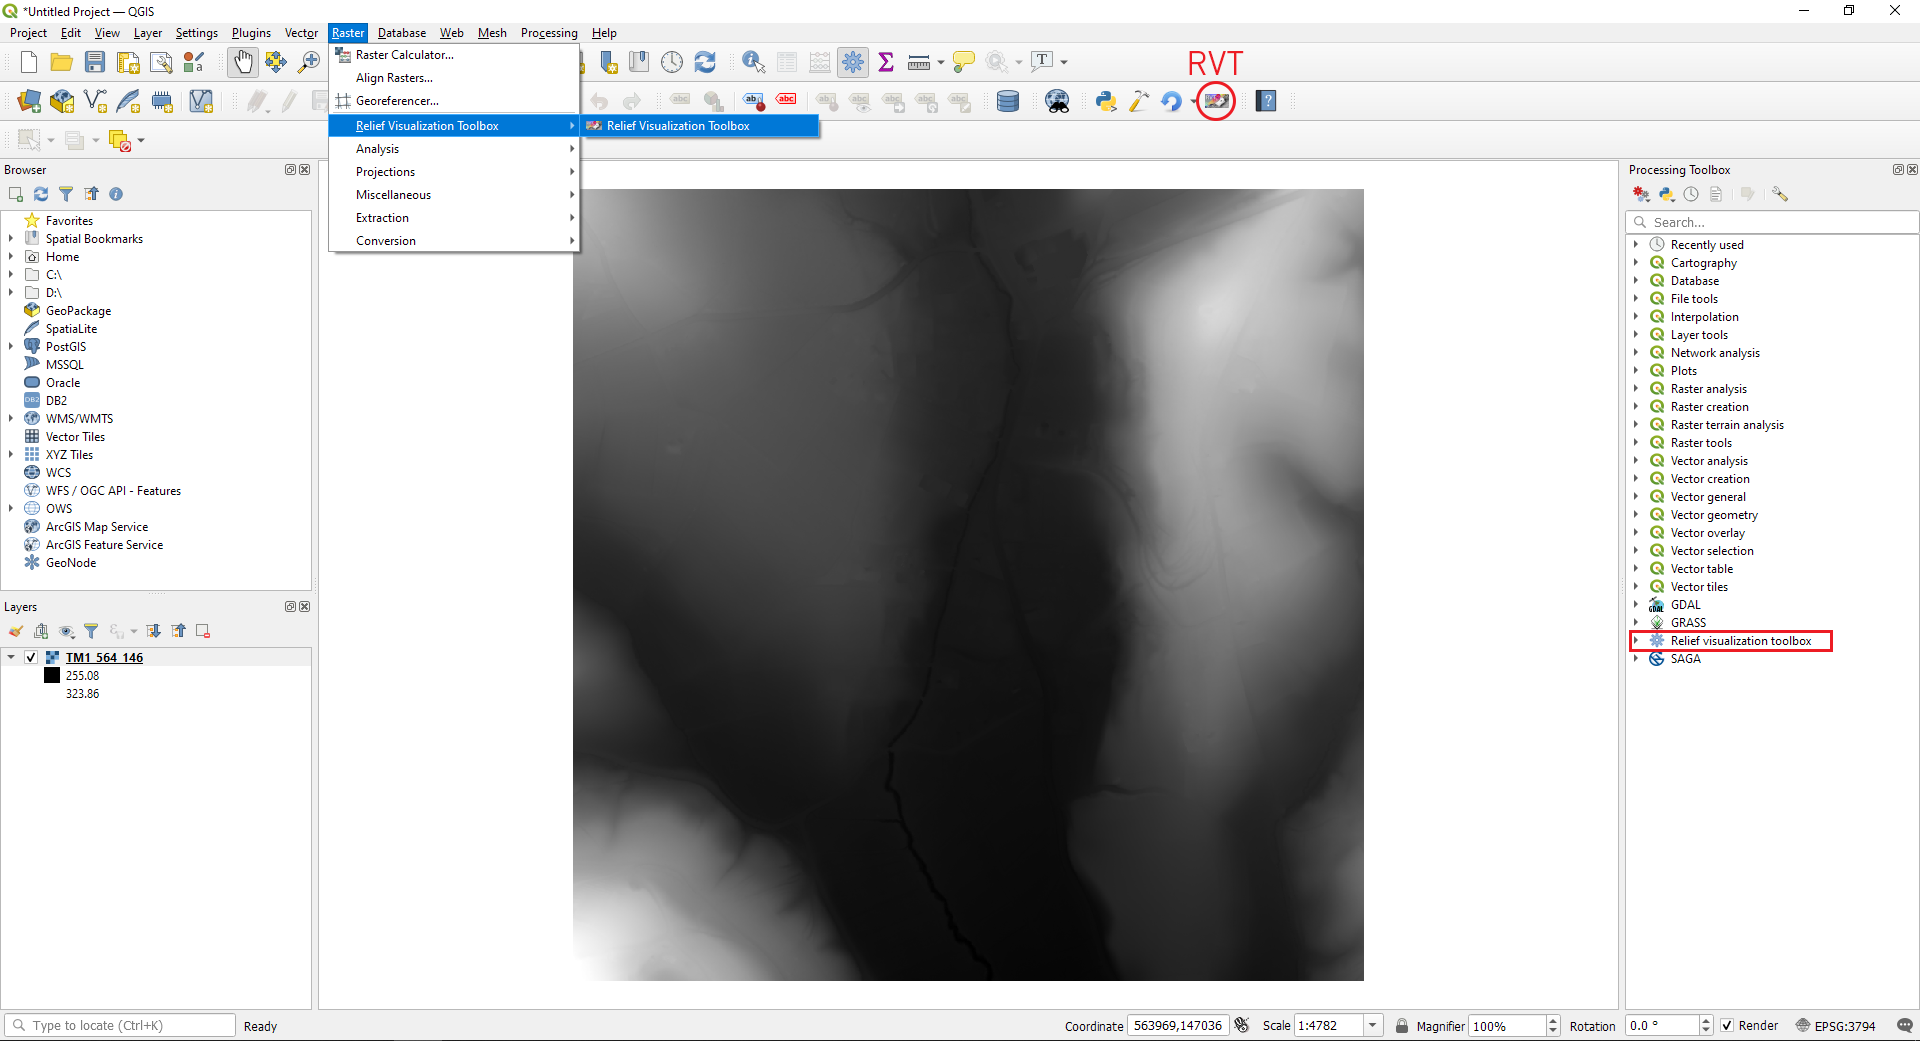
Computing visualizations
Select the DEM in
List of currently selected files:, then select theVisualizationstab. In theVisualizationtab selectpreferred visualizationsand set their parameters (options).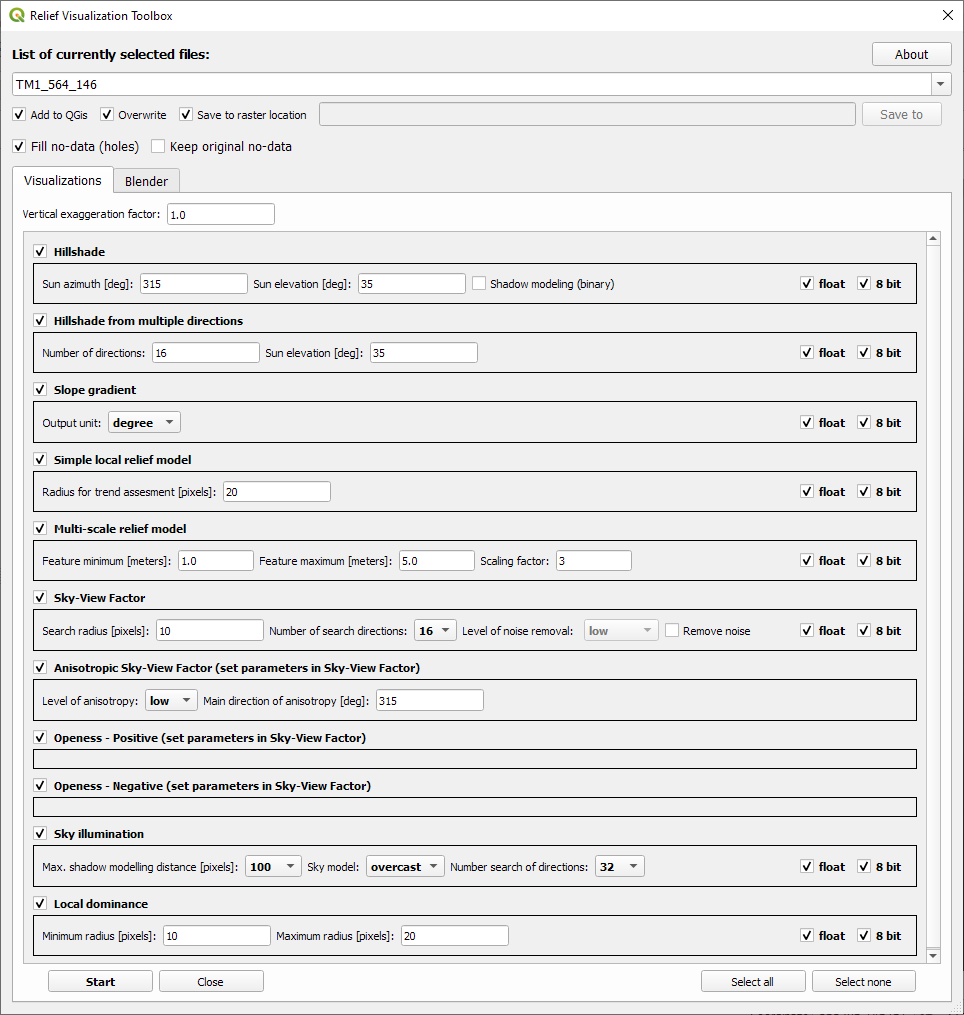
Select
Startto calculate the visualizations.
The visualizations are stored as GeoTIFFs in the same folder as the input file, or to a custom location (if the Save to raster location check box is unchecked, and the Save to directory is set).
Visualizations are also added to the main window of QGIS if the Add to QGIS check box is checked. If the Overwrite check box is checked, the program overwrites any existing visualization files.
See also
Find out more about visualizations and their parameters in rvt.vis.
Using the blender
Chose a DEM in
List of currently selected files:, then choose theBlendertab. In theBlendertab select yourBlend combination:or build your own in layers.
You can add your own custom combination to the list. Write a name in the Combination name text field and select Add. To remove it, just select it in the (Blend combination list) and select Remove.
You can also save a specific combination to a JSON file (if you want to share it, for example). To do this, input its name (in the Combination name text field) and select Save ... (then select the location and name of the file).
Saved JSON combinations can be added by selecting the Load ... button (select file). You can change the parameters for each visualization method in the blend combination in the Visualizations tab.
If you check the Use preset values for terrain type it applies the selected terrain type settings (this changes the normalization min and max, and visualizations parameters). If you check Save visualizations, all the visualization parameters used in the blender combination will be saved.
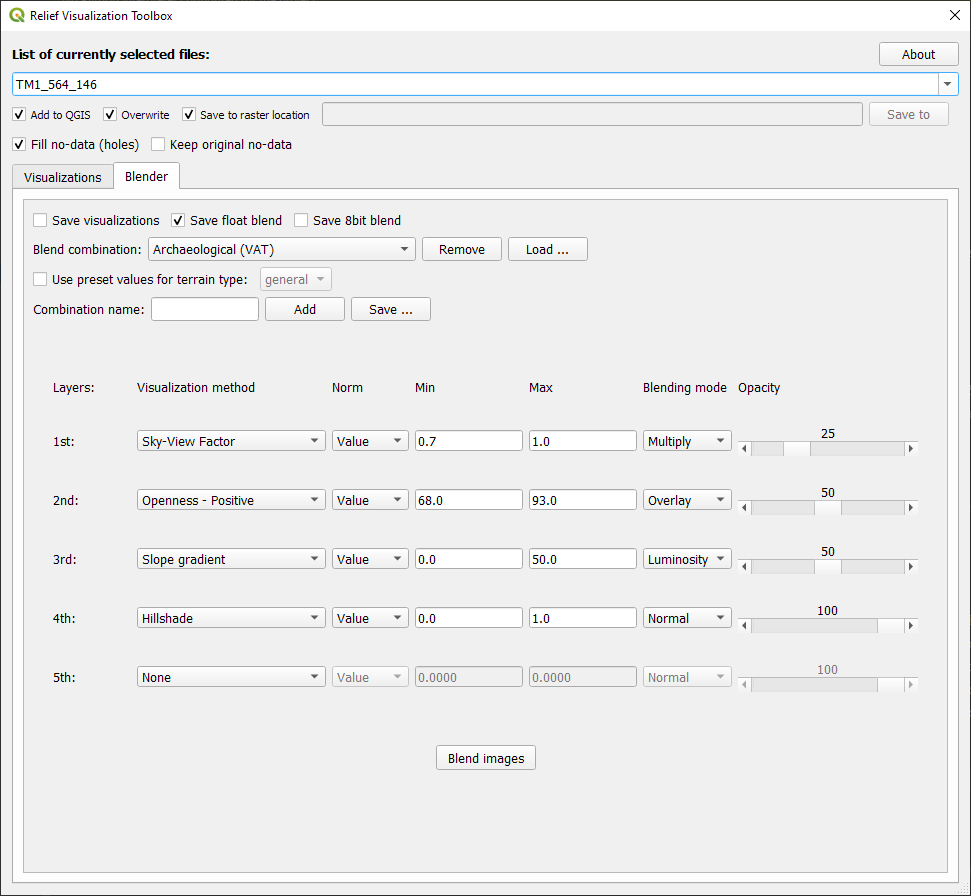
Select
Blend imagesto calculate the blended (fused, combined) image.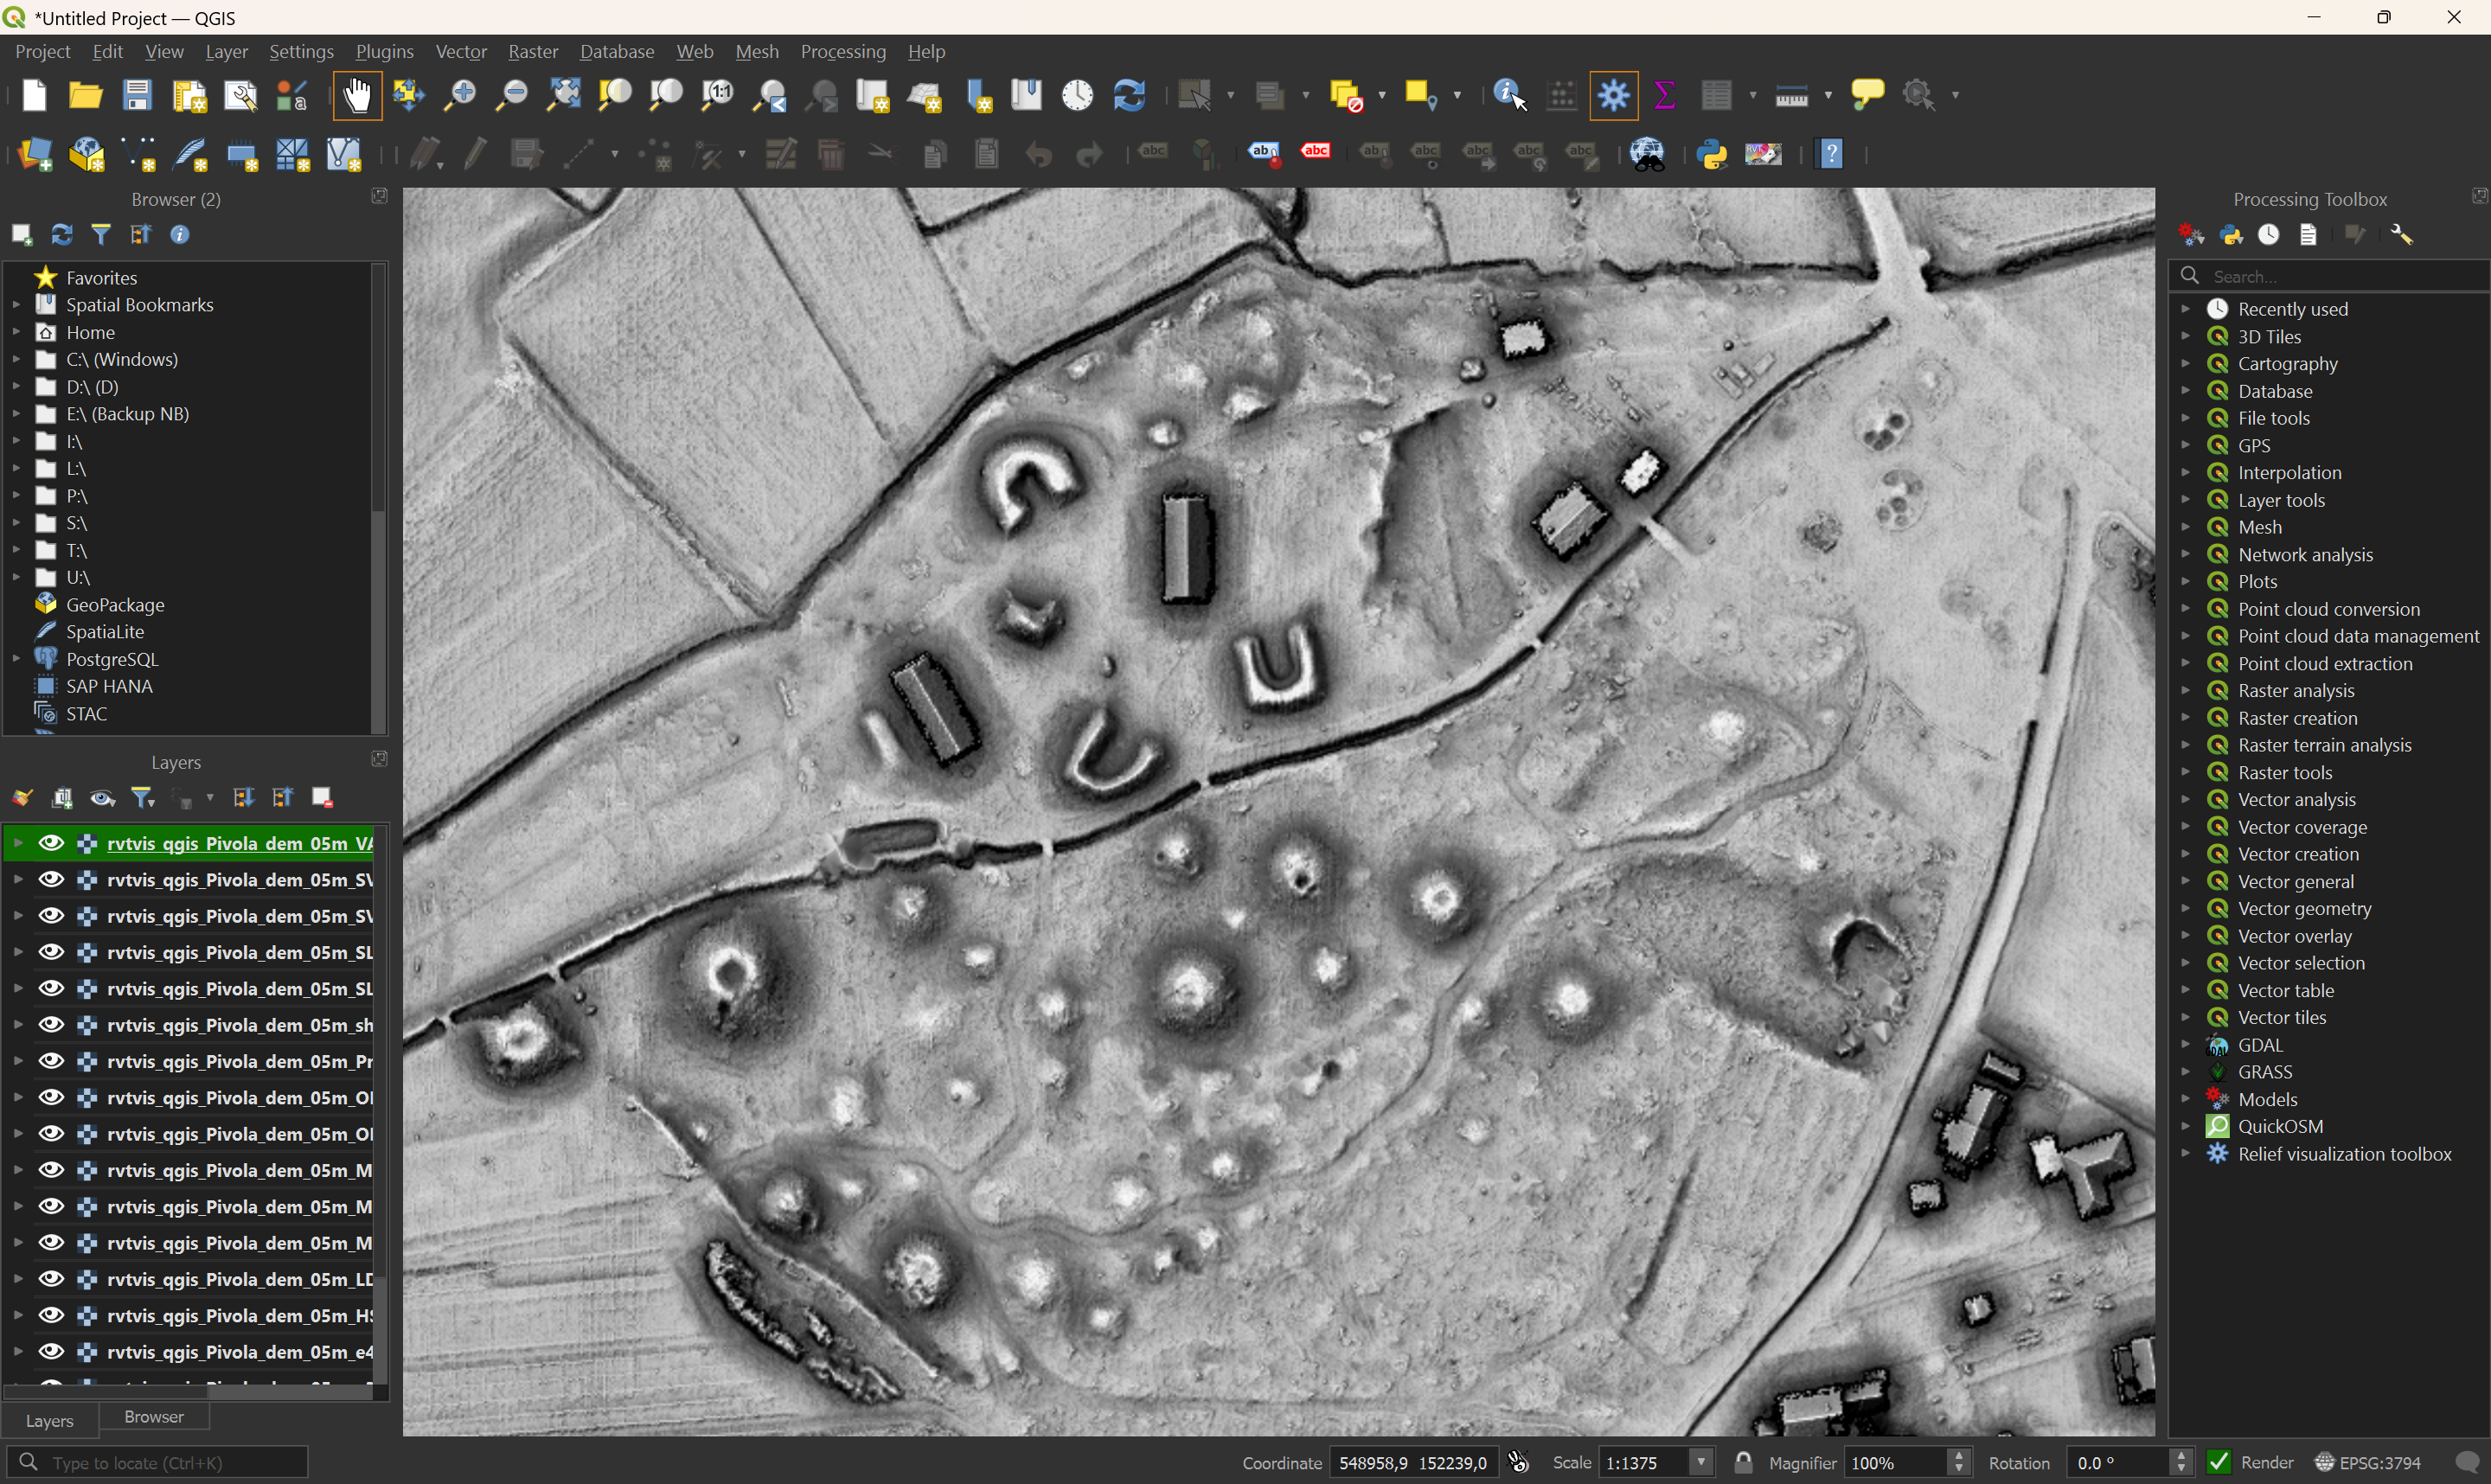
The blended image is stored as a GeoTIFF in the same folder as the input file or to a custom location (if Save to raster location check box is unchecked and a directory is set in the text field next to it).
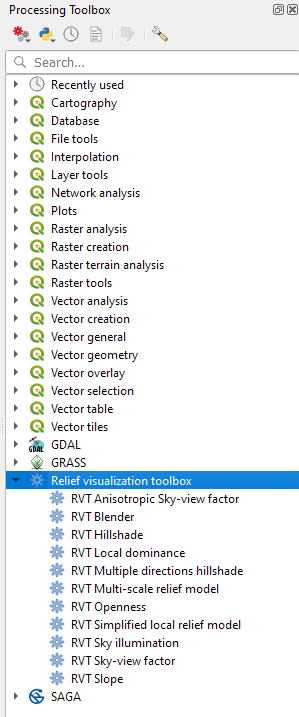
Using the processing functions
Go to the
Processing Toolbox → Relief visualization toolboxto access all the RVT visualization functions.